
LCA of PVC: Why Is It More Complex Than PE or PP?
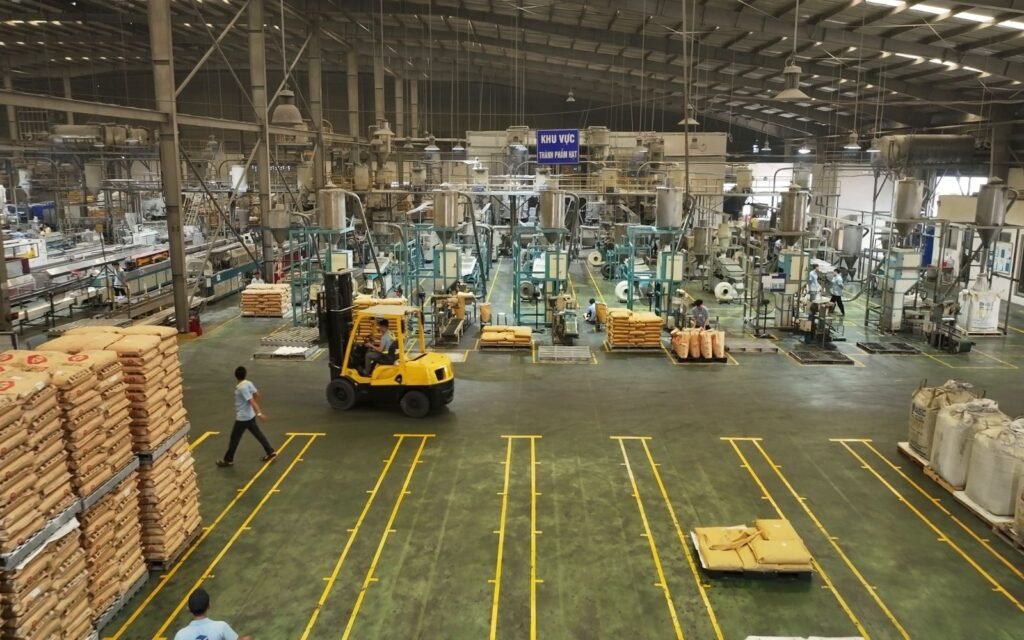
PVC carbon footprint calculations cannot be compared directly against PE or PP using a simple per-kilogram number. The Life Cycle Assessment (LCA) of PVC differs because its molecular structure differs in raw material origin. About 57% of PVC’s molecular weight comes from chlorine — produced via brine electrolysis, not petroleum. This creates two opposing consequences: on one hand, PVC’s fossil hydrocarbon footprint per kilogram is lower than PE or PP; on the other, the chlorine electrolysis process consumes energy-intensive electricity, and the power source (coal vs. renewables) directly affects each plant’s actual GWP.
Reference GWP Data from EPD and Eco-Profiles
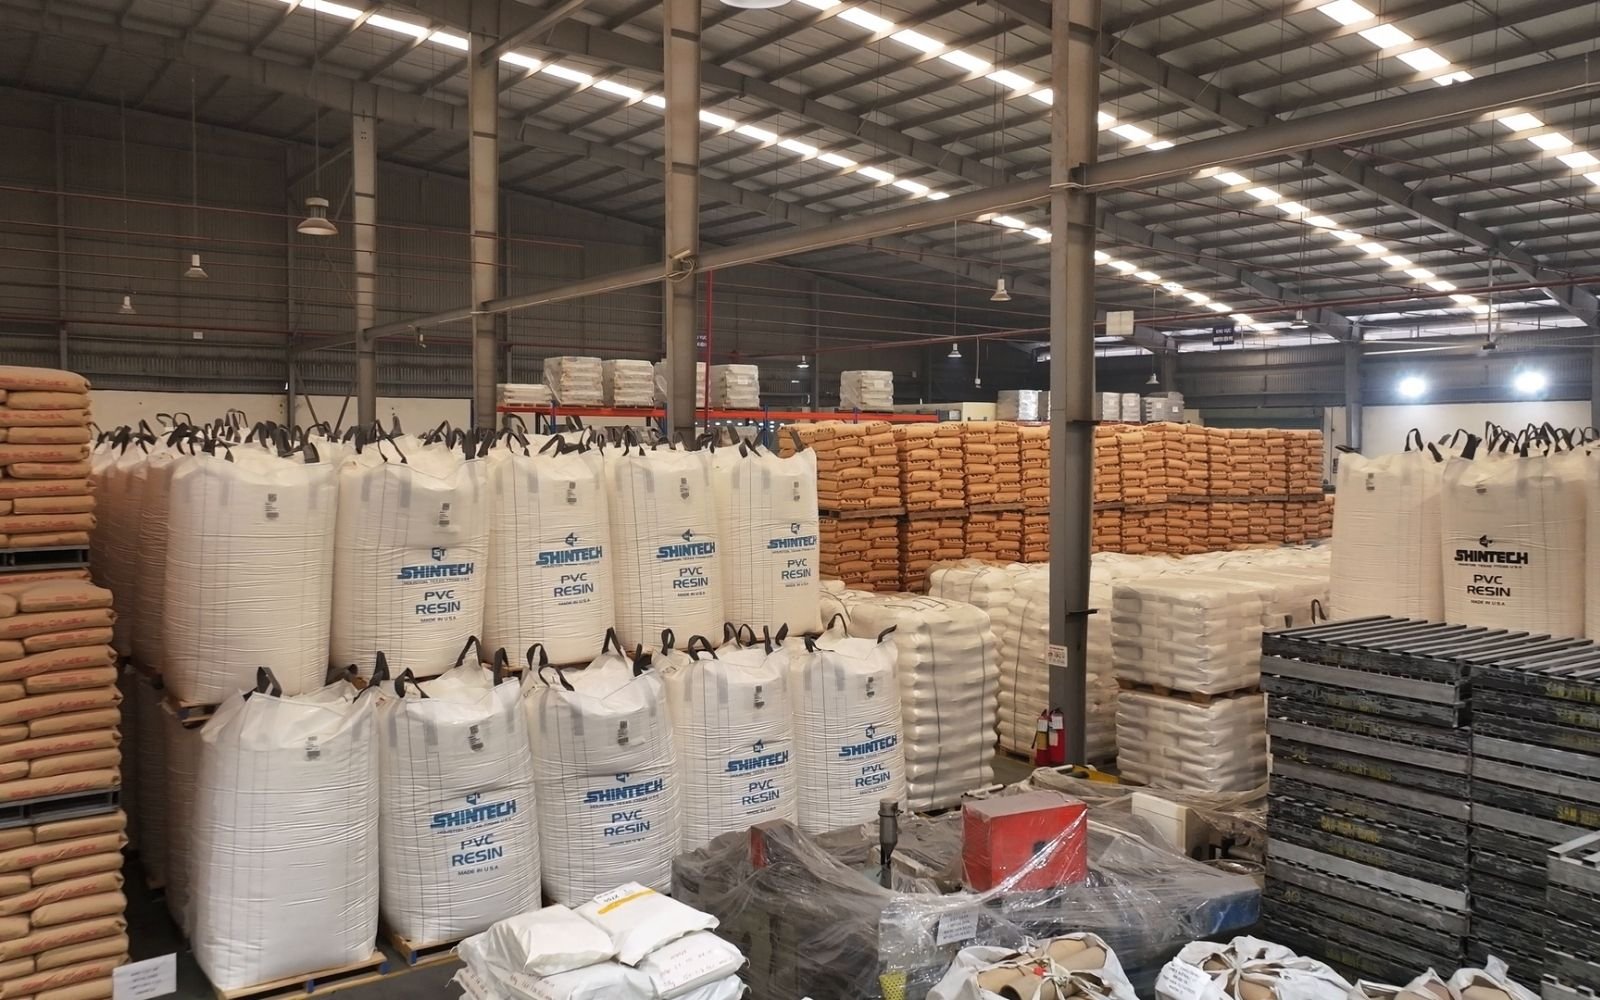
PlasticsEurope maintains an Eco-profiles database for European polymers, using ISO 14044 methodology, updated periodically. This is the official reference source cited by EPDs (Environmental Product Declarations) across the plastics industry.
| Material | GWP (kgCO₂eq/kg) | Notes |
| PVC resin | 1.9 – 2.1 | Eco-profiles PlasticsEurope 2023 |
| PP (polypropylene) | ~1.7 | Eco-profiles PlasticsEurope 2023 |
| ABS | ~3.5 | Eco-profiles, varies by formulation |
| PC (polycarbonate) | ~5.2 | Eco-profiles, produced from BPA |
| PVC compound (flexible) | 2.2 – 2.8* | *Estimated, depends on plasticizer and additives |
Source: PlasticsEurope Environmental Profiles Database 2023; LCA methodology per ISO 14044
A question worth asking: the GWP of PVC compound at a specific production facility can differ significantly from the European average, depending on the national power grid, machine efficiency, and additive ratio. A manufacturer in a country with a clean power grid (hydropower, high renewables) will have significantly lower GWP than one relying on coal power.
Incineration and End-of-Life Treatment: An Easily Overlooked Point
When PVC is incinerated, HCl (hydrochloric acid) is generated in the exhaust gas. This is not a direct GHG issue (HCl is not a greenhouse gas), but it requires specialized flue-gas treatment that not every waste incinerator has. In a full LCA, PVC’s end-of-life treatment cost is higher than PE/PP when accounting for environmental impacts outside GHG scope. This is one reason why a simple GWP comparison between polymers can be misleading.
CSRD and Scope 3: Pressure from Large Buyers
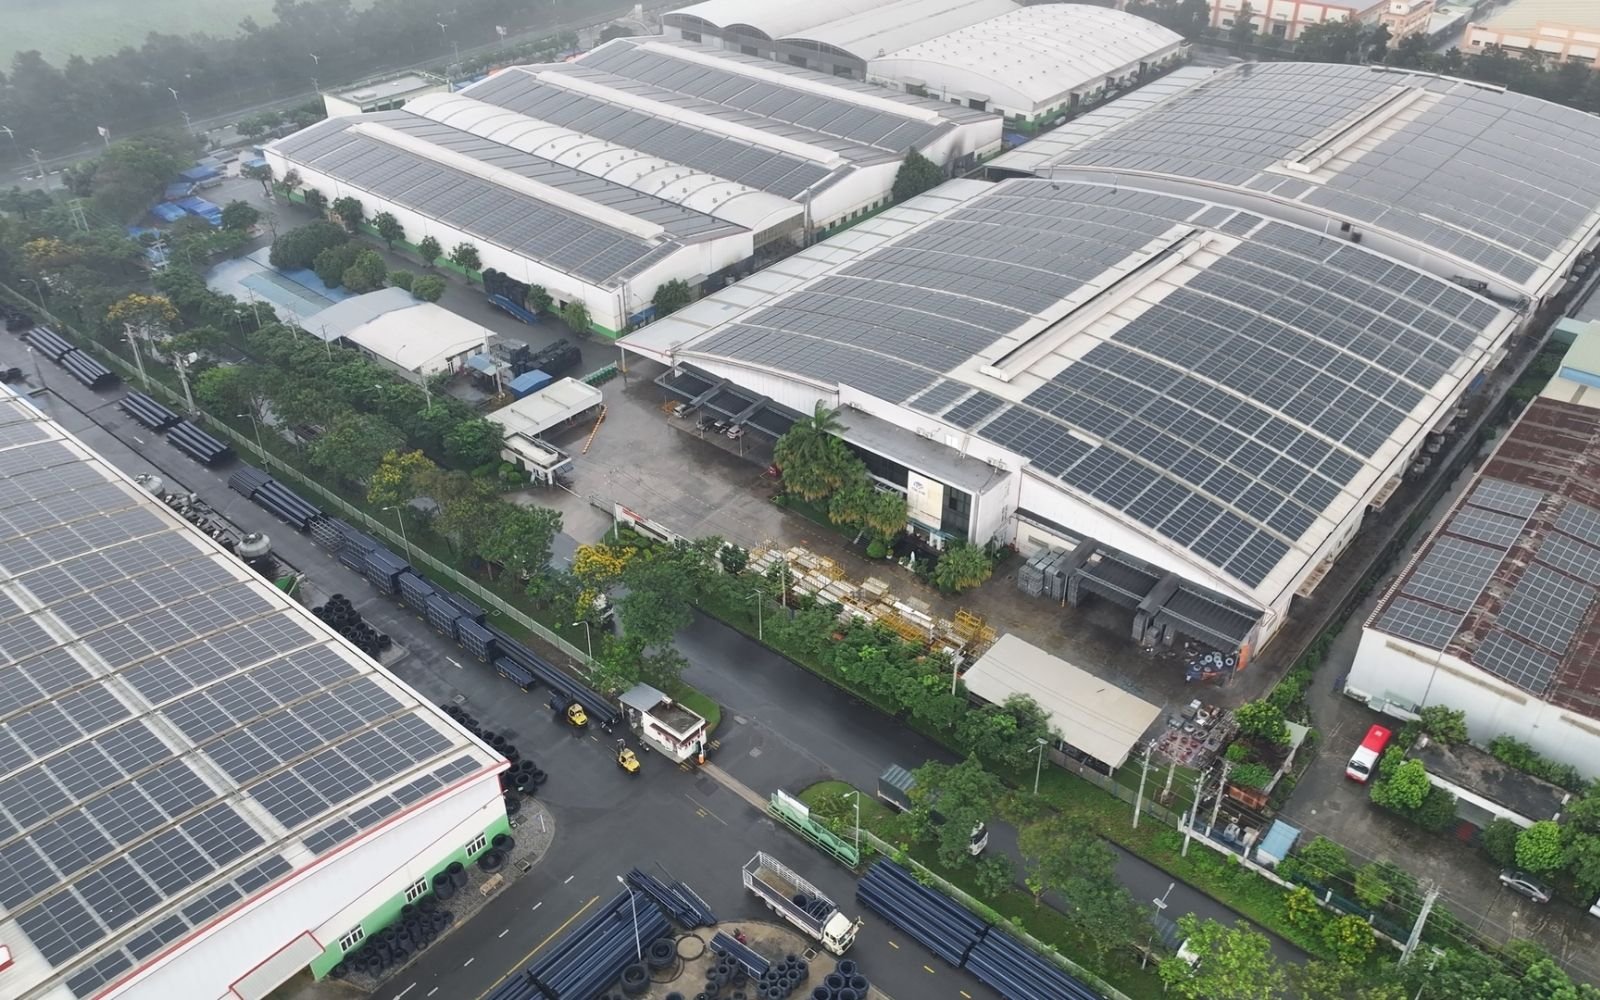
The EU Corporate Sustainability Reporting Directive (CSRD), applicable from FY2024 reporting for large companies and from 2025–2026 for medium-sized enterprises, requires Scope 3 emissions reporting — covering emissions from the entire upstream supply chain. Under the GHG Protocol Corporate Value Chain Standard, purchased goods and services fall under Scope 3 Category 1 — typically the largest-share category in a manufacturing company’s total Scope 3 emissions.
Practical consequence: multinational corporations subject to CSRD are, and will increasingly, require suppliers to provide product-level carbon footprint data — not industry-average estimates, but EPD certificates or Product Carbon Footprint (PCF) per ISO 14067 methodology, for each SKU.
| 📋 Checklist for Procurement & Sustainability Teams 1. Require compound suppliers to provide EPD or PCF per ISO 14067 — not just SDS. 2. Verify LCA methodology: cradle-to-gate or cradle-to-grave? Does the system boundary include additives? 3. Check the manufacturer’s power source — coal vs. clean electricity can create a GWP difference of up to 30–40%. 4. Store data in a format compatible with the GHG Protocol, ready for Scope 3 reporting. |
| ❓ Open Question Can your current compound supplier provide an EPD certificate or product-level carbon footprint per ISO 14067? And if their power source is mainly coal, how much higher might their actual GWP be compared to the PlasticsEurope benchmark — and how does that affect your company’s Scope 3 report? |
Source: PlasticsEurope Environmental Profiles 2023; ISO 14044 (LCA methodology); ISO 14067 (PCF); GHG Protocol Corporate Value Chain Standard; CSRD Directive (EU) 2022/2464; ECHA Guidance on Information Requirements